BI Reporting & Dashboards
Interpreting & Visualizing Data For Actionable Insights
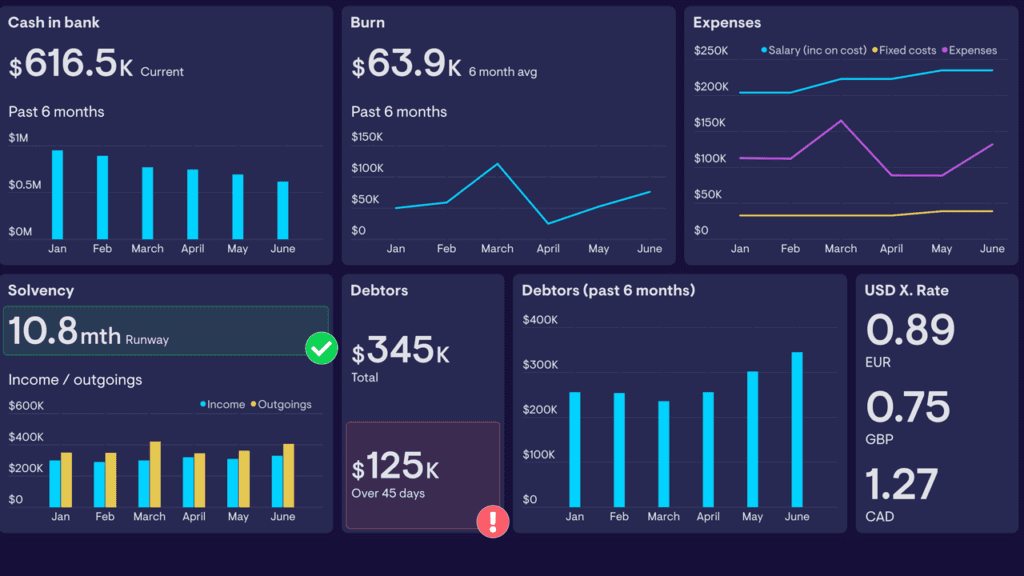
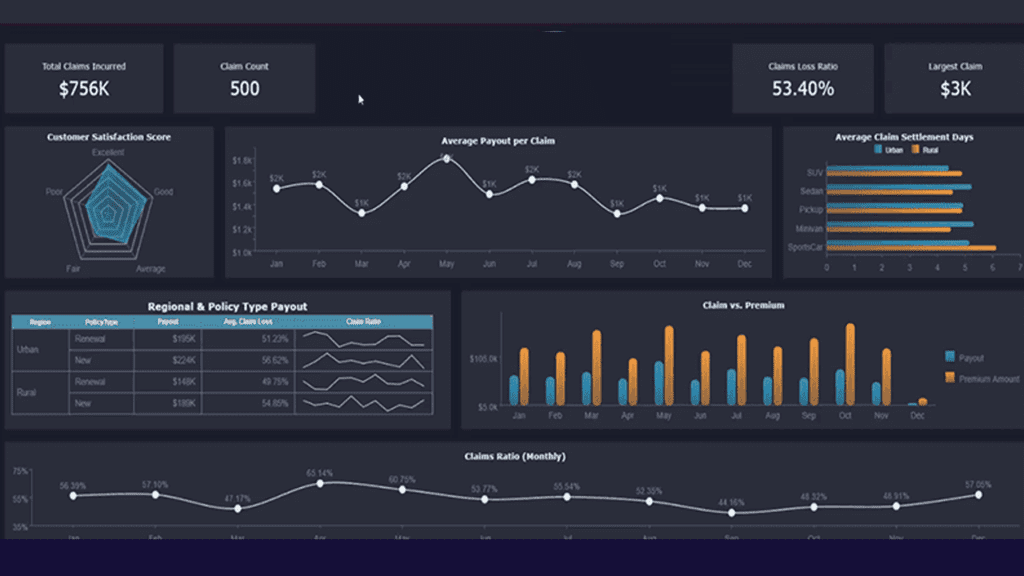
BI reporting & dashboards are data visualization and analysis techniques. These strategies help businesses to measure the status of their performance. To sum up, BI dashboard converts raw data into useful insight as charts, infographics, and heat maps. Our BI reporting & dashboards make it easier to view essential insights and forecast future business processes in 360-view. Meanwhile, businesses can easily achieve their goals and make informed decisions using our creative business intelligence solutions in assistance with BI reporting analysts.

Data Visualization
Get data into charts, infographics & heat maps, so you can find essential insights & forecast future business. To make it easier for outliers detection, patterns & trends analysis.

Business Gains
Data & BI developers are experts at orchestrating processes & fine-tuning specialized BI solutions to help our clients turn data into significant business gains.

Embedded Reporting
Get embeddable analytics developed for your business. Let’s enhance business performance & generate value by using forecasts, optimization & easy integrations.

Data Reporting
Get a data reporting dashboard created with tools that convert unstructured data into graphs, diagrams & dashboards.

Informed Decisions
Our BI services ensure owners make informed decisions based on data insights. We help clients plan & execute proper business intelligence.

Mission Fulfillment
Achieve strategic goals & make informed decisions with our innovative BI solutions. Our experts can swiftly assess your digital environment & recommend BI solutions.
Intelligent BI Reporting & Dashboards For Data Driven Business Insights
Organize large chunks of data for profitable business decisions. Above all get accurate data insights that support instant decision-making. Our experts assist in collecting, storing, organizing & analyzing data with realistic BI reporting and dashboards.

Business Intelligence Processing

Analytics Processing
Manual Data analysis to extract relevant & reliable information for relevant people.
Querying
Requesting databases or data warehouses to extract relevant information via APIs.
Reporting
Generating business intelligence reports for stakeholders.
Business Intelligence Processing
01
Analytics Processing
Manual Data analysis to extract relevant & reliable information for relevant people.
02
Querying
Requesting databases or data warehouses to extract relevant information via APIs.
03
Reporting
Generating business intelligence reports for stakeholders.

BI Dashboards for Business Users to Draw Opportunities
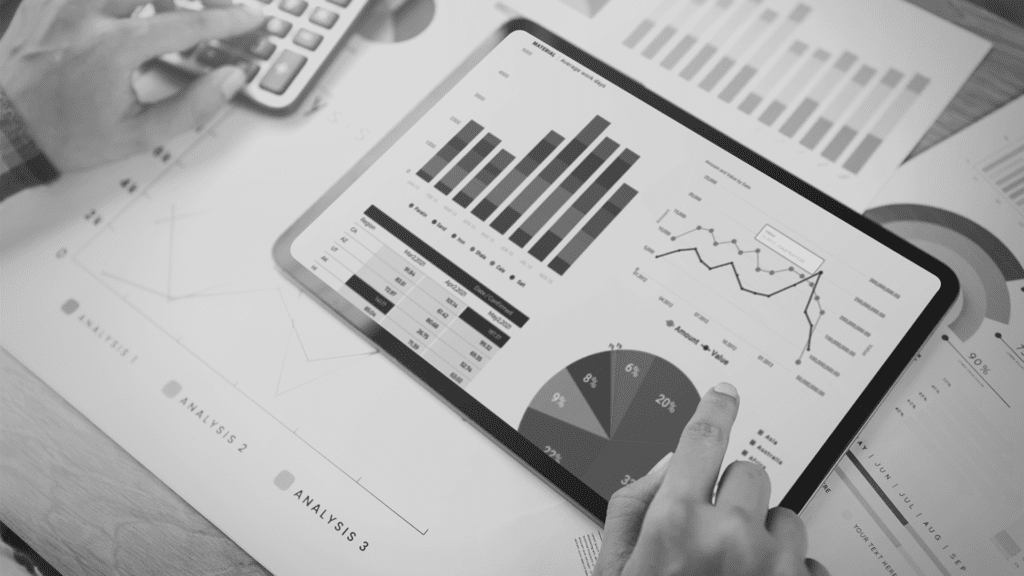
Get your data into business intelligence reports and dashboards to unleash your business potential. We as a data analytics services provider enable companies to understand what their data is actually saying. Odyssey Analytics helps with BI dashboards and data visualizations through Gantt Charts or Heat Maps. These data visualization services track key performance indicators & other metrics for sustainable growth.
Frequently Asked Questions
Data visualization is pivotal in BI as it enables businesses to quickly identify patterns, trends, & anomalies in their data. It leads to better & improved decision-making resulting in more promising outcomes.
BI reporting and dashboards provide real-time insights to identify issues quickly, get the latest growth prospects and make informed decisions. Besides, these data analytics services enable data to speak its story itself.
Choose the right data analytics company by evaluating factors such as the complexity of your data, quality of services, positive customer feedback & use cases they have solved. Odyssey Analytics is an eminent Artificial Intelligence & Machine Learning company enabling companies in the United States with the most recent technologies.
Incorporate data visualization into your business strategy by identifying critical data points and creating compelling visualizations that communicate insights & enable data-driven decisions.
Enhance ROI with business intelligence & Dashboard by selecting suitable data sources and defining KPIs. In addition, leveraging analytics & reporting capabilities to identify areas where improvements can be made.

